How Uber Saved $35M on Ads: Lessons in Marketing Analytics
By: Roman Myskin - Sept. 16, 2025I found an article by Sundar Swaminathan, “How Uber Saved $35M a Year on Ads” and I want to highlight some points for improvement. Don’t consider this a professional critique; for me, it’s just an exercise and an opportunity to note some valuable recommendations. I have no doubt that a team of professionals wrote this article and that some points were omitted for better readability.
Don't mix dimensions
The article starts with turning off Meta in the US and Canada, which highlights the first problem: it mixes completely different dimensions. The US and Canadian markets are incomparable in size and industries. If you put your data into one bucket, you may find apparent benefits, but you won’t understand which market was affected significantly because you don’t know which one made the difference.
What is the problem of “saw $XX in revenue and Y% growth”?
Regarding statements like “saw $XX in revenue and Y% growth”—this is a real problem for marketers, but not for the reason many assume. The issue is not that marketers increase budgets instead of optimizing. For example, our revenue might grow by $20k, which is 1200% growth, but we won’t mention that we increased our budget from $1,000 to $10,000, and our actual ROAS decreased. Many marketers don’t understand how to conduct proper A/B tests, and common metrics such as CAC, CLV/LTV, ROAS, ARPU, AOV, GM/CM, CR, CTR, CVR, CPC, CPL, and CPA are not always suitable for this purpose.
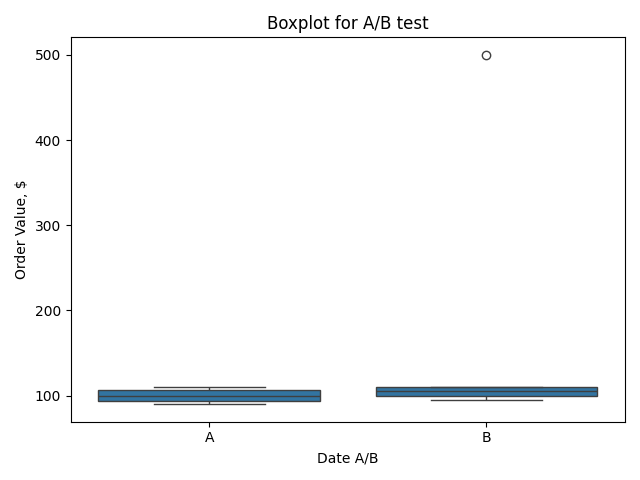
Here’s an example. You have an epoxy resin store that sells products for homeowners as well as for large art projects. You conduct some tests, like turning off Meta Ads. You look at your AOV and see that in the first period it was $80, while the second period shows an AOV of $182. Significant growth, right?
But this apparent growth is misleading. You didn’t include a B2B vs. B2C comparison, which explains what actually happened:
|
Date A/B |
Order Value |
B2B/B2C |
|
A |
$90 |
B2C |
|
A |
$110 |
B2C |
|
A |
$95 |
B2C |
|
A |
$105 |
B2C |
|
B |
$95 |
B2C |
|
B |
$105 |
B2C |
|
B |
$100 |
B2C |
|
B |
$110 |
B2C |
|
B |
$500 |
B2B |
This can be easily observed in a Box-and-Whiskers plot.
Ask more questions
The next step is essential for data analysis: asking the correct questions. However, the analysis in the article suggested that only seasonality affected company revenue. It also highlighted features that don’t significantly impact revenue, such as Marketing Spend, Product changes, and the Macro context—including seasonality—which cannot be influenced without awareness campaigns.
I’m not saying every research study must uncover a major discovery. When I studied physics, there was a common principle: “A negative result is still a result.” But my question is this: if these questions didn’t indicate how to adjust your marketing strategy, are you sure you extracted enough insights from the analysis?
Don't drop data you don't like
A few points about seasonality: this is something that requires significant resources to analyze, especially if your account doesn’t have a lot of data. But Uber has data spanning eight years. What is the problem with plotting all eight years instead of only comparing this year to last year?
I know this is not a strong argument, and every data analyst will say that comparing eight lines is complex enough. I’m just highlighting a common simplification: “We can’t do anything; it’s seasonality.” Of course, you may not need to take action—maybe even turn off Meta Ads. But perhaps there were opportunities to optimize this channel that were missed.
These missing dimensions are a major gap in the article. We can’t see research broken down by location, how turning off Meta affected other channels, or whether other metrics changed. We only have CLC and CAC.
Missing opportunities
My point is that marketers should consider missing opportunities. Turning off a digital channel is a bold move, and you should extract all possible insights to share with the marketing community. But as a reader, this article suggests that Meta Ads aren’t working, and you should focus on finding other locations, building a brand, acquiring drivers, and pivoting toward acquiring eaters. It misses an explanation of why Meta Ads aren’t working. The market was always saturated, and revenue is not determined solely by the relationship between signups and spend.
As I said, this is not a debate; I just noted points I would like to see in a strong marketing case study. Here are some pieces of advice for marketers to avoid these mistakes:
Recommendations for Marketers
- Consider all relevant dimensions in analysis (locations, segments, channels).
- Ask the right questions to derive actionable insights.
- Segment data properly (B2B vs. B2C, regions, campaigns).
- Use metrics appropriately for A/B testing.
- Avoid oversimplifying conclusions or attributing results only to seasonality.
- Maximize insights from bold decisions like turning off digital channels.
Home